 It’s been a while since I’ve done one of these posts, so I’m going to try to consolidate a lot of information into a single post, rather than trying to break it out into 5 separate entries. This post will outline the same stats we’ve looked at in the past, but it’s going to cover the period from Nov. 1, 2013 all the way through March 31, 2014. By March 31, we had been running event tracking on the UMW website for about 8 months.
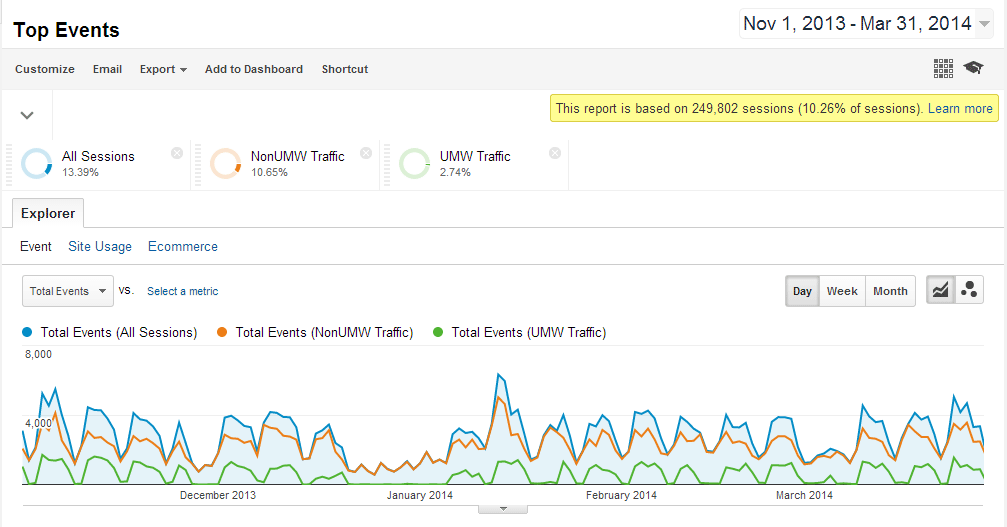
Baseline Information
The stats included in this article are pulled from the Analytics reports for the entire UMW website during the month of October. During that time, there were 922,596 “users” on the site (which appears to be analogous to “unique visitors” in the old Analytics interface), 2,434,796 total “sessions” (which appear to be analogous to “visits”) and 6,243,639 total page views. The home page of the site was viewed 2,338,154 times; 778,806 of which were “unique pageviews”.
Helpful Links
During this 5 month period, our users clicked on links within Helpful Links 337,077 times; this continues the trend where almost 5.5% of the total page views on the UMW website included clicks on items within Helpful Links.
Of those ~337,000 clicks, more than 327,000 were clicks within the Online Tools area, making up just over 97% of the clicks within the Helpful Links section, again. Almost 37% of those clicks — 119,911 — led to our Webmail landing page. Just over 25% — 82,185 — of those clicks led to Canvas, our learning management system. Almost 25% this month — 80,671 — pointed to our internal student and employee portal/intranet. Finally, a little over 7% of the clicks — 23,902 — led users to our student information system; just over 2.4% of the clicks — 7,879 — led to the system we use to allow students and their families to add money to their ID cards; 2.2% of the clicks — 7,211 — led to our Library website; and less than 1% led to each of the other 5 areas linked within that section (just under 2% total for all 5 links).
Links within the Resources section were clicked only 9,330 times, making up just over 2% of the total clicks. Among those links, the Registrar’s office is the clear leader, making up more than 28% — 2,660 — of those clicks, with the Academic Calendar accounting for ~9% — 828 — of the clicks. The Human Resources and Bookstore links were the only other links in that section clicked more than 500 times (692 and 581, respectively) during the reporting period.
The Feedback link (currently the only “other” link tracked as part of Helpful Links) was clicked 513 times.
Header Links
Links within the header area of the site were clicked 41,094 times during this reporting period.
Among these links, the “Careers at UMW” link (leads to our list of employment opportunities) was the most popular, with a total of 10,741 clicks. The next most popular link in that section was the Prospective Students link, with a total of 6,569 clicks. The next 2 in the list were the Directory link and the Maps and Directions link, with 5,509 and 5,237 clicks each, respectively. Contact Us was clicked 4,415 times, while Parents was used only 2,352 times this month. People clicked to look at the Events page 2,701 times, while the News and Campus Advisories links were each clicked fewer than 2,000 times.
The Home Page
Together, all of the links exclusive to the home page were clicked a total of 25,280 times, meaning again that only about 1% of the home page views resulted in someone clicking on items that are exclusive to the home page. The home page itself, though, still has a low bounce rate (only 0.56%) and an exit rate of just over 27%, meaning that, while the exclusive items on the home page may not be grabbing people’s attention, visitors aren’t simply showing up on the home page and running away.
The Slideshow
During this reporting period, the links within the Top Stories section of the page started to fall in popularity a bit more, making the slideshow appear more popular in comparison. The slideshow garnered a total of 11,085 clicks. This time, the popularity of the slides coincided exactly with their position in the slideshow (meaning that the first position was the most popular, the tenth position was the least popular, and everything in between was right-on).
Those slide positions were clicked the following numbers of times:
- 3,579
- 2,083
- 1,353
- 971
- 734
- 648
- 471
- 460
- 422
- 324
Observations based on these figures:
- Continuing on the trend from previous periods, the third slide position still garnered at least 10% of the total clicks in the slideshow
- This time, positions 7-10 made up less than 5% of the clicks within the slideshow each; meaning that the other 6 positions were still higher than 5% of the total clicks.
- The slideshow links themselves seemed to be less popular, on average, than they were in previous periods (for instance, the total slideshow clicks during October were 2,501; during September, there were 2,246 clicks; on average, the slideshow was only clicked 2,217 times per month during this period)
Top Stories
These links made up more than 33% — 8,395 — of the clicks on the home page during this period. Separating the traffic between internal and external visitors, it looks like external visitors clicked to view a Top Story 5,363 times. The most popular story this month, with 439 total clicks (361 external), was “Kiplinger Names UMW Best Value in Small Colleges“. The next two stories, “UMW Closed for Winter Break Through Jan. 5” (which does not appear to still be published) and “Jepsons Give $1 Million to Restore UMW Amphitheater” garnered 361 and 350 (322 and 253 external) clicks, respectively. Rounding out the top 5, we had “UMW Student Receives Scholarship to Study in China“, clicked 282 times; and “Great Lives Lecture Series Kicks Off in January“, clicked 243 times.
Other Home Page Links
During this reporting peiod, we still had many of the same “calls to action” appearing in the various other areas of the home page as we have had for the previous few months. This time around, “Virtual Tour” was the most popular link outside of the slideshow and Top Stories, again. That link was clicked 1,091 times during the month, 1,023 of which were reportedly from outside the campus network.
Our “Open House” flag was clicked 1,052 times, 994 of which were by external visitors, while “Apply to UMW” was clicked 634 times, 595 of which were external, and “Graduate Information Sessions” was clicked 448 times, 429 of which were external.
Footer Links
Links within our mega footer navigation area were clicked a total of 6,852 times. 6,618 of those appear to have come from external visitors. The most popular link in that section, with 867 total clicks (all but 19 of those were external), leads to our undergrad admissions page. The rest of the top five in that area lead to “Bookstore”, “Fast Facts”, “Contact UMW” and “UMW Eagles” (a link to our athletics site) with 838, 595, 468 and 351 clicks, respectively. Other than 10 clicks on “Contact UMW”, none of those clicks reportedly came from inside of our campus network.
Among the global footer links, one link was clearly the most popular: “Login” (with 3,139 clicks – almost 56% of the total clicks in that area). Oddly, only about 55% of those clicks came from inside our campus network, meaning that either a lot of people are clicking that link that shouldn’t be, or a lot of our content managers are working on the site from outside of our network.
The second and third most popular links in that area, with only 361 and 234 clicks each, were “Map” and “Facebook”. Neither of those links were reportedly clicked by anyone inside our network.
The Viewbook thumbnail was clicked a total of 643 times during this period. During that time, 107 of those clicks were on our International viewbook; this time, though, only 49 of those clicks were from within the US, other clicks on the International viewbook came from Thailand (29 clicks), Japan (10 clicks), Kenya (10 clicks) and Venezuela (10 clicks).
Conclusion
As we begin to look more and more at the data, we can start to draw some conclusions and see some patterns. Many of the numbers mentioned in this article are very close to being 5 times the numbers mentioned in previous articles (which makes perfect sense, since it is 5 months worth of data).
With these data, we can begin to identify some items that are being presented effectively, and which are being ignored or going unused by our visitors. We have already begun to make some design decisions based on this information (which I’ll talk about in an upcoming article), and will hopefully be able to support more design decisions with these data in the near future.
Leave a Reply